The Results and Statistical Tests
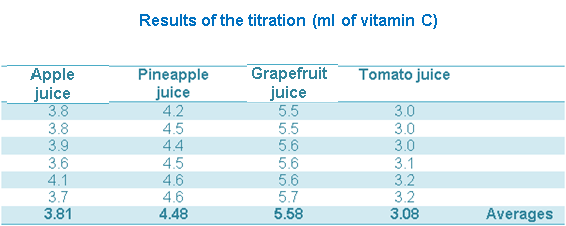
The results gained by doing this experiment are in the table above. These results will be used to carry out statistical tests . This will also be done to either prove or disprove my null hypthesis.
The Statistical tests Once the results were obtained it was possible to carry out statisical tests to compare the gained data to one another.The statistical test being carried out is t-test. This is a statistical test used to compare two sets of data by looking at the means. The reason chosen to carry out the t-test is because it is used to compare the means of the data in relation to how the data varies.
The moles of DCPIP and Viatamin C need to be calculated first.
Moles= mass/Mr = 0.025/290.1= 0.86 moles of dcpip in titration. The molar ration of DCPIP to vitamin C is 1:1. So the moles of vitamin C are the same as that of DCPIP. To work out the concentration: n=c x v / 1000 = 0.1 (concentration of dcpip) x 3.81 / 1000 = 0.00038 moles DCPIP in solution. mol/ml = 0.00038/25=0.0000152 X 176 (Mr) = 0.0026752 X 100 to get the g/100ml = 0.26752g/100ml C = n x 1000/ v = 0.000381 x 1000 /2= 0.1905. The mass of vitamin C in the solution is 0.86 x 176 = 151.36 Each results needs to be divided by 0.15 to work out the g/ml. The results to this are shown in the tables to the right in the left hand colunm. The other colunms are being used to work out the standatd deviation. Standard deviation and Standard error First you have to calculate the standard deviation for each fruit . This is done by creating the tables to the right. Grapefruit Juice: The standard deviation is 1.08. Pineapple juice: The standard deviation is 0.0116 Apple juice: The standard deviation is 0.0175 Tomato juice: The standard deviation is 0.0157 Standard deviation is how the data varies. In this case you are comparing the fruit juices. Standard error is the standard deviation of the how data varies is statistics.
Now the t-Test can be carried out -------->
Comparing the results obtained with expected results: There is 1g to 1ml. There are 1000mg in a gram so:
Grapefruit juice is expected to have 6mg of vitamin C per 100ml. The results gave grapefruit to have 0.268mg per ml. Grapefruit juice is expected to have 0.06g per 100ml and the results gained show 0.268mg per 100ml. This is quite a bit lower.
Pineapple juice has an expected value of 15mg of vitamic C per 100ml. The results show it had 0.335mg per ml. Pineapple juice should have 1.5g per 100ml and the results show 0.335mg per 100g. The difference is less significant that the results from apple.
Apple juice is expected to have 11mg of vitamin C per 100ml. The results show it had 0.393mg per 100ml. Apple juice should have 1.1g per 100ml and the results gave a value of 0.393mg per 100ml. The difference again is less significant than from apple juice.
Tomato juice is expected to have 19mg of vitamin C per 100ml. The results show it had 0.217mg per 100ml. Tomato juice should have 1.9g per 100ml and the results showed a value of 0.217mg per 100ml. The difference here is again quite significant.
| Standard Deviation for the fruits (g per ml) 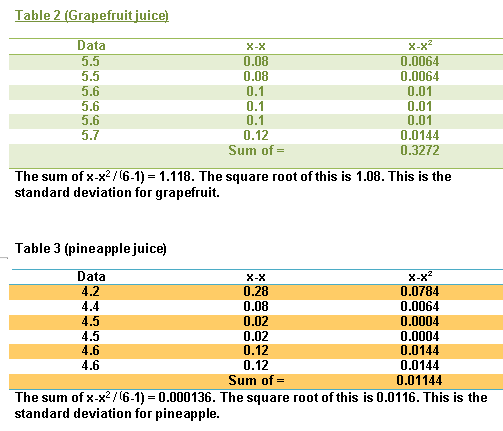 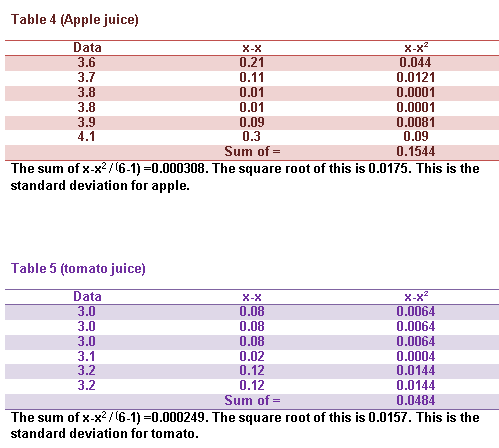
t-Test Pineapple juice First compare the mean amount of vitamin C in apple juice (0.268) with pineapple juice which has a mean of 0.0116. You take the first mean which is grapefruit juice and the next mean which is pineapple juice and find the difference: (X1-X2) = (0.268- 0.0116) = 0.256 Then the means must individually be divided by the number of samples sqaure rooted. (In this case the square root of 6 which is 2.45) 0.268/2.45 = 0.109 0.0116/2.45=0.00047 These results are then added to give 0.109. To get the "t" value the difference in means is divided by this value. t= 0.109/0.256= 0.425. To work out the degrees of freedom the total number of samples must be added then minus 2. so 6+6-2 = 10. This value is used to read of the degrees of freedom table. It shows there is over a 20% significance level between grapefruit juice and apple juice. Apple juice Then compare grapefruit juice it with applet juice which has a mean of 0.393. You take the first mean which is grapefruit juice and the next mean which is apple juice and find the difference: (X1-X2) = (0.268-0.393) = 0.125 Then the means must individually be divided by the number of samples sqaure rooted. (In this case the square root of 6 which is 2.45) 0.393/2.45 = 0.160 0.269/2.45=0.109 These results are then added to give 0.269. To get the "t" value the difference in means is divided by this value. t= 0.125 /0.269= 0.464. To work out the degrees of freedom the total number of samples must be added then minus 2. so 6+6-2 = 10. This value is used to read of the degrees of freedom table. It shows there is over a 20% significance level between grapefruit juice and apple juice. Tomato juice Then compare grapefruit juice it with tomato juice which has a mean of 0.486. You take the first mean which is apple juice and the next mean which is grapefruit juice and find the difference: (X1-X2) = (0.268-0.486) = 0.218 Then the means must individually be divided by the number of samples sqaure rooted. (In this case the square root of 6 which is 2.45) 0.268/2.45 = 0.109 0.486/2.45=0.198 These results are then added to give 0.307. to get the "t" value the difference in means is divided by this value. t= 0.218/0.307=0.71 to work out the degrees of freedom the total number of samples must be added the minus 2. so 6+6-2 = 10. this value is used to read of the degrees of freedom table. It shows there is over a 20% significance level between grapefruit juice and apple juice.
|